Laser Profile Inspection Cell
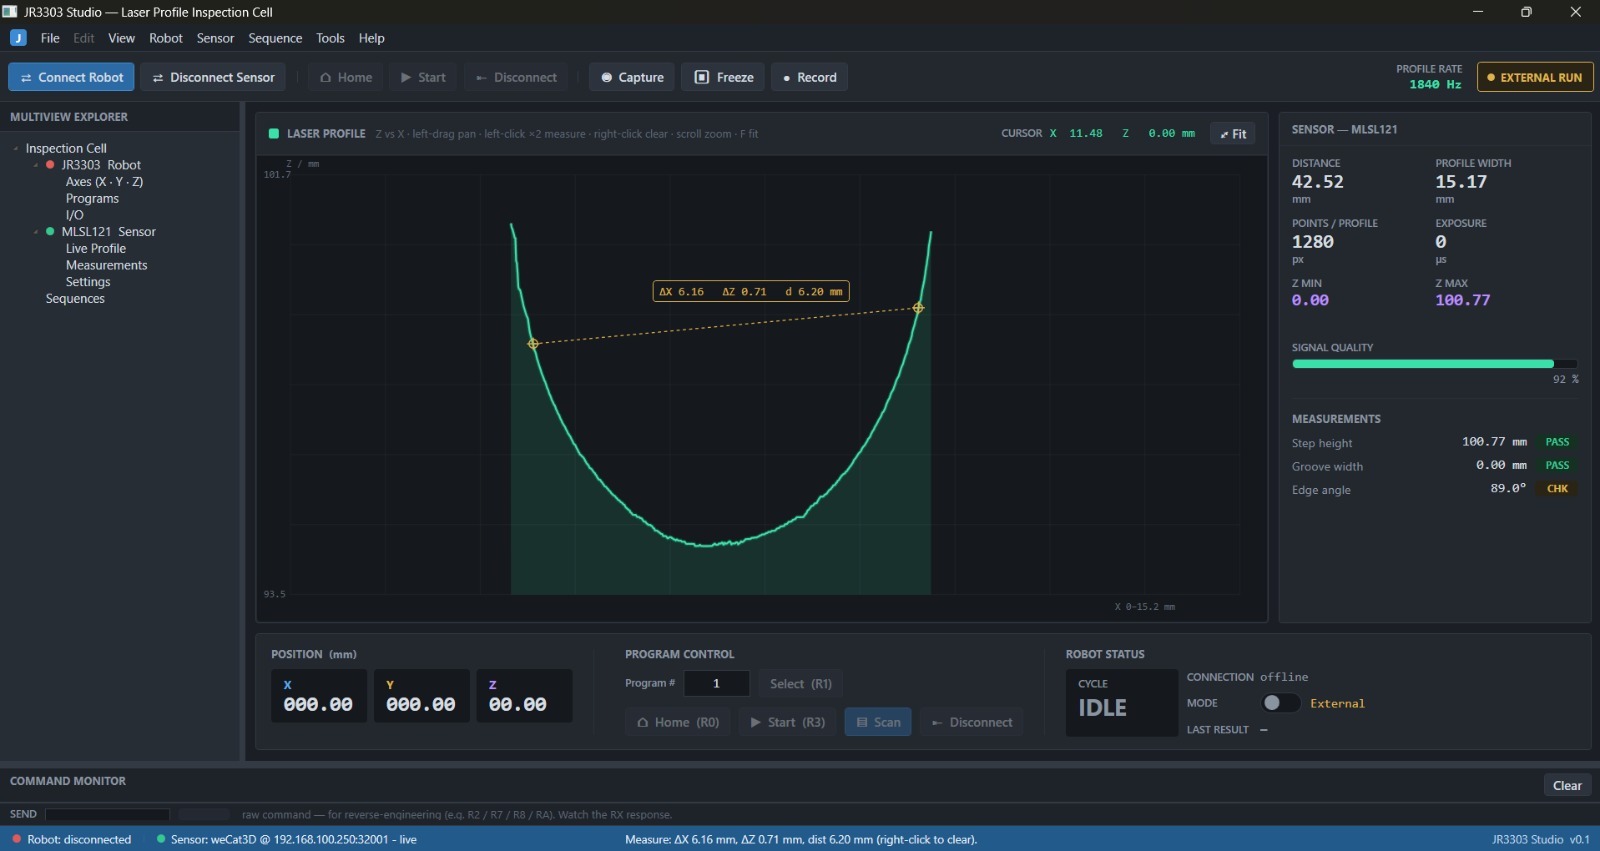
JR3303 Studio: one native Windows app that unifies a Janome JR3303 robot and a wenglor weCat3D laser profile sensor into a single inspection cell. Live profiling, on-screen measurement, robot control, and traceable CSV, all in one dashboard.
The problem
An inspection cell like this ships as two separate worlds. The robot has its own vendor software; the laser sensor has another. To profile a part you tab between two programs, one to move the robot and one to read the sensor, and nothing is tied together or logged. You can see a measurement on screen, but it lives and dies in the vendor tool.
I wanted one app that connects both devices, shows the live laser cross-section, lets you measure it on screen, and writes every result to a file, so the cell is one thing to operate instead of two.
What the app does
- Live laser profile graph — pan, scroll-zoom, auto-fit, mouse-follow cursor readout.
- On-screen measurement — click two points for ΔX, ΔZ and distance; points snap to the nearest surface point.
- Real-time readouts — distance, profile width, point count, Z min/max, signal quality and flatness σ.
- Run program + synchronized scan — runs a taught robot program and logs every time-stamped profile to CSV.
- Record & replay — full runs to .jsonl, so a captured run plays back for development and demos.
- Offline mode — a mock robot and simulated sensor, so the whole app runs with no hardware attached.
Every measurement, logged
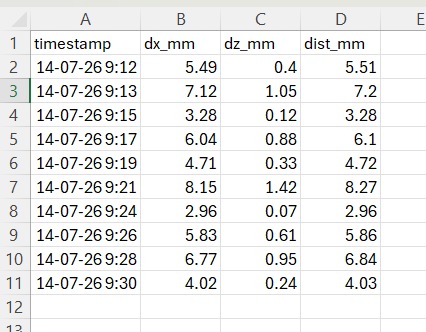
Each capture appends one row to measurements.csv (timestamp, dx_mm, dz_mm, dist_mm), so a run is traceable and opens straight in Excel. No copy-paste out of a vendor tool.
Under the hood
The sensor sits behind a single ISensorSource interface, with three implementations: simulated, file-replay, and the real weCat3D. A new sensor slots in without touching the UI, and the whole app runs offline against the mock.
The sensor streams at roughly 2 kHz, far faster than a screen needs, so the UI renders through a coalesced ~30 FPS timer to stay responsive under load. Invalid or no-return points are marked NaN so they never corrupt the statistics or the graph.
Where it stands
Phase 1 (app shell + robot control) and Phase 2 (live laser profiling) are done and verified on real hardware, including real 1280-point streaming in millimetres.
Phase 3 is proposed: a 3D point cloud, robot↔sensor sequencing to scan along a path, automatic pass/fail tolerances, and reporting.
Built with
A working prototype, verified on real hardware. The code is private, but I'm happy to walk through the architecture and a live demo.